
|
|
| Home | Hardware | Projects | Code and datasets |
|
This page provides some of the datasets and programs obtained by different WSN deployments and experiments. Particular care was taken in commenting and detailing resources available on this page, in order to make them easily and quickly reuseable. We kindly ask you to acknowledge our efforts for providing these resources in any published work. >R Code and data used for generating results and figures in
Y. Le Borgne, J.M. Dricot, G. Bontempi. Principal Component Aggregation for Energy-efficient Information Extraction in Wireless Sensor Networks. Chapter accepted for publication in Knowledge Discovery from Sensor Data, Taylor and Francis/CRC Press, 2008.
description
The archive contains the R code and the dataset used for generating the results and the figures presented in the article referenced above. Downloads
Implementation in R and dataset (ZIP format) >3D Accelerometer Demo
description
Two MoteIV Tmote Invent are used, one as the 'base node' and one as the 'moving node'. When we move the 'moving node', the measurements of the accelerometer are recorded and sent through the wireless radio to the base node. Data is then forwarded to a Java program displaying a wood tray that follows the mote inclination. A ball rolls on the tray as the inclination changes. (See the video below). This demo was showed @ Exposition des Sciences. Video
Downloads
Tinyos and Java implementation (ZIP format) >Motion capture
description
Eight Tmote Invent were placed on different parts of an individual,
and acceleration readings along 2 axes were recorded every 10 ms for
different sequences of body moves (Simple moves, such as arm, leg of
head moves, or complex moves, such as standing up, sitting down, walking.
running). Datasets to come. A video of corresponding moves will also
be made available.Sensor positions
To come... Downloads
To come... >Ant Nest
description
Deployment of 20 Tmote sky .
Temperature, humidity and light measurements were collected at four
locations in five different rooms. Data were collected every five minutes,
for a five day period. map of the deployement 
downloads
Data set (ZIP format)
>Library 2
description
The aim of the experiment was to gather data to test localization
algorithms. Deployement of 19 Tmote
sky , each node took all his sensors readings plus his neighbors
rssi and lqi values. The values were taken at different radio power
levels, from radio power level 1 to 31, 10 readings were taken at each
radio power level. map of the deployement 
downloads
Data Set (TGZ format - 1MB - 4MB uncompressed) TinyOS and Java implementations (TGZ format - 8KB - 25KB uncompressed) >Library 1
description
The aim of the experiment was to gather data to test localisation algorithms.
Deployement of 19 Tmote sky , each node took all his sensors readings plus his neighbors rssi and lqi values. The values were taken every minute for a period of more than 24 hours.
map of the deployement
downloads
Data Set (TGZ format - 3MB - 18MB uncompressed) TinyOS and Java implementations (TGZ format - 8KB - 24KB uncompressed) >Cluster room
description
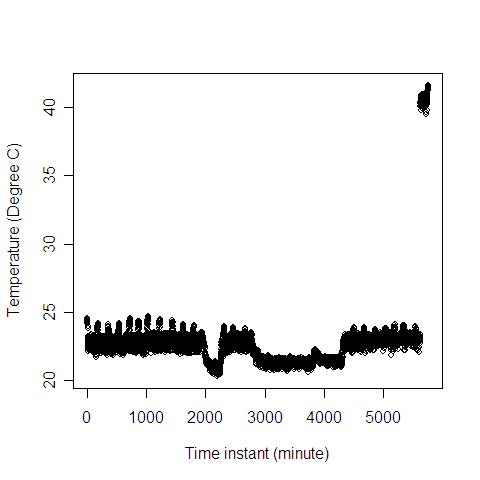
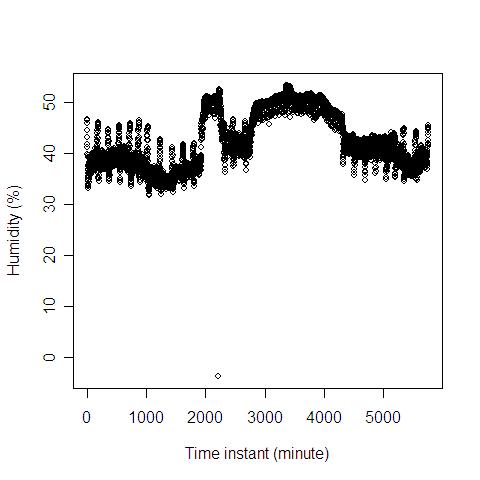
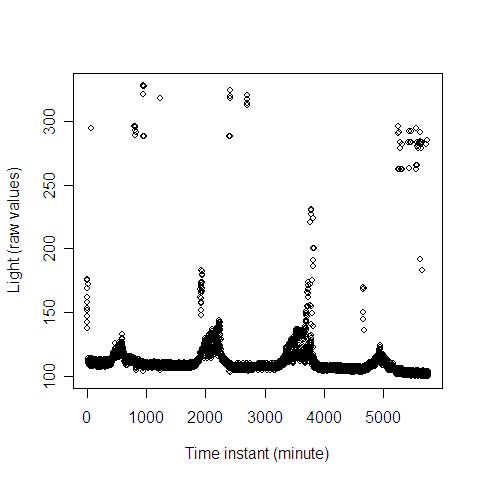
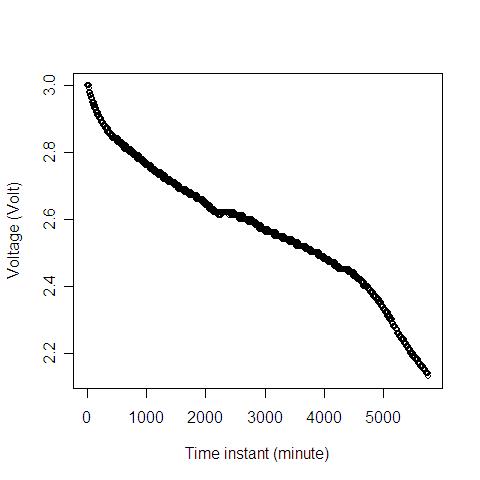
Deployment of 7
Tmote sky taking readings every 1 minute for a period of 4 days
in a cluster room. An air conditioning system set at 22°C is installed
in the room. This gives a total of 5760 readings for each Tmote Sky
sensor (Temperature, humidity, TSR - Total Solar Radiation, and voltage).
Batteries of motes 1,2,4,5 and 7 were depleted after about 2 days.
downloads - TXT format - 5760 rows and
8 columns - Each file is about 150KB
Temperature (Celsius degree) - View sensor 3 data Humidity (Percent) - View sensor 3 data TSR (raw values) - View sensor 3 data Voltage (Volt) - View sensor 3 data These data are not preprocessed and therefore contain a few outliers (With mote n°3, one negative value in humidity measurements, or erroneous measurements close to 40°C for temperature data as batteries are dying out). >Synthetic data - Heat sources
description
These datasets were collected from simulated experiments using Matlab
PDE toolbox. Matlab code for generating these datasets is also provided.
Data are archived in ZIP format,
and contain:
downloads
See environmental modelling on the project page >External ressources
Links
Intel Lab Data
|
|
|

|